We have moved!

Thursday, December 29, 2011
GOLD'S D-WAVE CONFIRMED
With the move below $1535 this morning gold has confirmed that it is still moving down into a D-Wave bottom. There has been some question as to whether or not the D-Wave had bottomed in September. The penetration of that intermediate low this morning confirms that the D-Wave did not end during the overnight selloff on September 26.
In the chart below I have marked with blue arrows the last several yearly cycle lows. As you can see they tend to occur in January or February. The timing band for the next cycle low should occur sometime in early to mid January. That should mark the bottom of this D-Wave decline with the slight possibility that there could be one more short daily cycle down bottoming in early February. This will almost certainly be dependent on whether the dollar cycle has one or two more daily cycles higher before rolling over into an intermediate decline. Current sentiment levels on the dollar index are suggesting only one daily cycle higher, which should signal a final bottom in the gold market sometime in the next 2-3 weeks.

If gold can make it back to the 50% retracement in the next couple of weeks I would probably be inclined to call a yearly cycle low at that point. If however gold holds above $1500 at the next daily cycle low due in early to mid-January then I would be wary of one more daily cycle down to test the 2010 consolidation zone and 50% retracement ($1400) sometime in early February.

The combination of the dollar rally out of its three year cycle low, a yearly cycle low, and a D-Wave decline are going to produce a very sharp correction in the gold bull market. Before this is over most analysts will declare the gold bull dead. On the contrary sometime early next year you are going to get the single best buying opportunity we will ever have to reenter the secular gold bull in preparation for the bubble phase that should top in late 2014 or early 2015.
As a matter of fact now that we have confirmed that this is an ongoing D-Wave decline Once that bottom has formed it will generate a violent A-wave advance that should test the 1800 to $1900 level rather quickly later this spring.

Serious money will be made during the A-wave advance. One just needs the patience to wait for the D-Wave to bottom before jumping back into the pool.
In the chart below I have marked with blue arrows the last several yearly cycle lows. As you can see they tend to occur in January or February. The timing band for the next cycle low should occur sometime in early to mid January. That should mark the bottom of this D-Wave decline with the slight possibility that there could be one more short daily cycle down bottoming in early February. This will almost certainly be dependent on whether the dollar cycle has one or two more daily cycles higher before rolling over into an intermediate decline. Current sentiment levels on the dollar index are suggesting only one daily cycle higher, which should signal a final bottom in the gold market sometime in the next 2-3 weeks.
If gold can make it back to the 50% retracement in the next couple of weeks I would probably be inclined to call a yearly cycle low at that point. If however gold holds above $1500 at the next daily cycle low due in early to mid-January then I would be wary of one more daily cycle down to test the 2010 consolidation zone and 50% retracement ($1400) sometime in early February.
The combination of the dollar rally out of its three year cycle low, a yearly cycle low, and a D-Wave decline are going to produce a very sharp correction in the gold bull market. Before this is over most analysts will declare the gold bull dead. On the contrary sometime early next year you are going to get the single best buying opportunity we will ever have to reenter the secular gold bull in preparation for the bubble phase that should top in late 2014 or early 2015.
As a matter of fact now that we have confirmed that this is an ongoing D-Wave decline Once that bottom has formed it will generate a violent A-wave advance that should test the 1800 to $1900 level rather quickly later this spring.
Serious money will be made during the A-wave advance. One just needs the patience to wait for the D-Wave to bottom before jumping back into the pool.
Wednesday, December 28, 2011
Thursday, December 22, 2011
Tuesday, December 20, 2011
Thursday, December 15, 2011
GOLD IS ON THE VERGE OF MOVING INTO THE BUBBLE PHASE OF THE BULL MARKET
I know that during a correction of the magnitude we are seeing right now it seems more like the gold bull is dead than on the verge of moving into what I expect will be one of the greatest parabolic moves in history.
However, all of the conditions necessary to launch the bubble phase are now in place. Gold is in the process of putting in an intermediate degree bottom. That bottom, which is only days away if it didn't already happen today, is going to be the single greatest buying opportunity, probably of the decade.
Gold sentiment is at multiyear lows. Retail traders that bought at $1900 have gotten wiped out. The media is full of stories calling for the death of the gold bull. Institutional traders from John Paulson, George Soros, and Dennis Gartman have all gotten knocked off the bull.
Breadth in the universally hated mining sector is back down to levels that have only been exceeded during the crash in 2008.

All the conditions are in place to launch the next stage of the secular bull market.
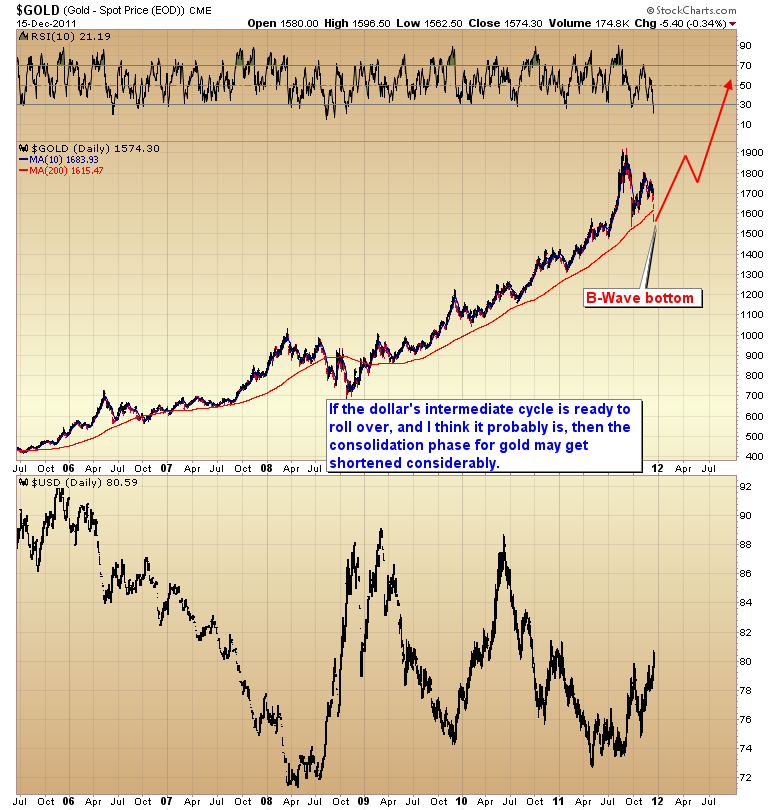
Up until now my expectation has been that we would see gold consolidate for probably the better part of a year before the next C-wave breaks out to new highs.

However, the scenario that is unfolding in the CRB and dollar indexes has me wondering if the gold bull isn’t going to start evolving much faster than I originally expected. Let’s just say that if I am correct and the dollar is on the verge of topping then we are probably going to see a much shorter consolidation than originally expected. Gold could launch much more quickly out of the B-Wave bottom than I expected and move to new all-time highs as early as the next intermediate cycle.
As a matter of fact I’m pretty confident that if the dollar turns down it is going to trigger the beginning of the third and final, bubble phase, in the gold bull market.
The public is already starting to become aware of the gold bull. All we need at this point to start the flood is for gold to recover quickly from this selloff. If gold quickly shoots back up and tags, or penetrates that big psychological $2000 number I expect it will be the siren call that draws the public into the bull market. And it is the public coming into a market that triggers the bubble phase.
During this phase of the bull I expect we will see the normal ABCD wave pattern break down as gold starts to accelerate into what will almost certainly be the most incredible parabolic advance, maybe in history. By the fall of 2014 I expect we will see gold somewhere between $7,000 and $20,000 an ounce.
I think tonight's premium report is important enough that I'm going to reopen the $1 trial subscription for two days. You will have access to the entire site for the next two days for the price of one George Washington. You can either keep your subscription and it will convert to a monthly at the end of the trial period or cancel it and you won't be charged another dime. Either way you will get access to a report that I think is important for every gold investor to read.
If you decide to cancel do so by following the directions on the home page of the website. Please allow one day to process your one dollar payment before canceling. Click on the link above to go to the premium website and then click the subscribe link on the upper right side to link to the subscription page.
Offer only valid for new subscribers. Former subscribers or previous $1 trial subscriptions will auto charge at the monthly rate.
However, all of the conditions necessary to launch the bubble phase are now in place. Gold is in the process of putting in an intermediate degree bottom. That bottom, which is only days away if it didn't already happen today, is going to be the single greatest buying opportunity, probably of the decade.
Gold sentiment is at multiyear lows. Retail traders that bought at $1900 have gotten wiped out. The media is full of stories calling for the death of the gold bull. Institutional traders from John Paulson, George Soros, and Dennis Gartman have all gotten knocked off the bull.
Breadth in the universally hated mining sector is back down to levels that have only been exceeded during the crash in 2008.
This sector has consolidated for so long that no one believes in mining stocks anymore. This is exactly the same sentiment that was prevalent in the silver market in the fall of 2010.
All the conditions are in place to launch the next stage of the secular bull market.
Up until now my expectation has been that we would see gold consolidate for probably the better part of a year before the next C-wave breaks out to new highs.
However, the scenario that is unfolding in the CRB and dollar indexes has me wondering if the gold bull isn’t going to start evolving much faster than I originally expected. Let’s just say that if I am correct and the dollar is on the verge of topping then we are probably going to see a much shorter consolidation than originally expected. Gold could launch much more quickly out of the B-Wave bottom than I expected and move to new all-time highs as early as the next intermediate cycle.
As a matter of fact I’m pretty confident that if the dollar turns down it is going to trigger the beginning of the third and final, bubble phase, in the gold bull market.
The public is already starting to become aware of the gold bull. All we need at this point to start the flood is for gold to recover quickly from this selloff. If gold quickly shoots back up and tags, or penetrates that big psychological $2000 number I expect it will be the siren call that draws the public into the bull market. And it is the public coming into a market that triggers the bubble phase.
During this phase of the bull I expect we will see the normal ABCD wave pattern break down as gold starts to accelerate into what will almost certainly be the most incredible parabolic advance, maybe in history. By the fall of 2014 I expect we will see gold somewhere between $7,000 and $20,000 an ounce.
I think tonight's premium report is important enough that I'm going to reopen the $1 trial subscription for two days. You will have access to the entire site for the next two days for the price of one George Washington. You can either keep your subscription and it will convert to a monthly at the end of the trial period or cancel it and you won't be charged another dime. Either way you will get access to a report that I think is important for every gold investor to read.
If you decide to cancel do so by following the directions on the home page of the website. Please allow one day to process your one dollar payment before canceling. Click on the link above to go to the premium website and then click the subscribe link on the upper right side to link to the subscription page.
Offer only valid for new subscribers. Former subscribers or previous $1 trial subscriptions will auto charge at the monthly rate.
The $1 offer has expired.
Mock portfolio change
The mock portfolio change has been posted to the website. I need as many people as possible to try and login so we can determine if the bandwidth we added yesterday is sufficient.
Wednesday, December 14, 2011
Saturday, December 10, 2011
WEEKEND REPORT
I think this weekend's report is probably one of the most important reports I've written for gold traders and investors as to what I think is in store the next couple of months.
I'm going to make the report available over the weekend for $1. Actually you will have access to the entire site for the next two days for the price of one George Washington. You can either keep your subscription and it will convert to a monthly on Tuesday morning or cancel it Monday night and you won't be charged another dime. Either way you will get access to a report that I think is important for every gold investor to read.
If you decide to cancel do so by following the directions on the home page of the website.
Click on the link above to go to the premium website and then click the subscribe link on the upper right side to link to the subscription page.
THE OFFER HAS NOW EXPIRED
I'm going to make the report available over the weekend for $1. Actually you will have access to the entire site for the next two days for the price of one George Washington. You can either keep your subscription and it will convert to a monthly on Tuesday morning or cancel it Monday night and you won't be charged another dime. Either way you will get access to a report that I think is important for every gold investor to read.
If you decide to cancel do so by following the directions on the home page of the website.
Click on the link above to go to the premium website and then click the subscribe link on the upper right side to link to the subscription page.
Thursday, December 8, 2011
Wednesday, December 7, 2011
Tuesday, December 6, 2011
Friday, December 2, 2011
Thursday, November 24, 2011
THE SECULAR BEAR MARKET & GOLD'S A WAVE ADVANCE
I have decided to post the weekend premium report to the blog this week. In the report I'm going to take a look at what has transpired, and what is likely to come, as the third leg down in the secular bear market begins to intensify.
Back in April of this year I warned investors to get out of stocks in their 401(k) accounts. At the time the dollar was moving into the timing band for a major three year cycle low. It has always been my expectation that the rally out of that major bottom would correspond with the stock market moving down into the third bear market leg of the secular trend that has been in place since 2000. As we now know the dollar did bottom in May of this year and that did correspond with the top of the cyclical bull market that began in March of 2009. It has also been my expectation that the next four year cycle low would occur in the fall of 2012, and that 2012 would be one of the worst economic years in human history.
This is already starting to unfold across the globe as social unrest that began in the middle east has spread to Europe and now the United States. Economic data has been steadily eroding for months now. We should expect this trend to continue and intensify as we get into 2012.
As most of you know I use cycles analysis and sentiment to determine likely timing band's for major turns in the stock market, gold and the dollar. This is what allowed me to anticipate a bottom in the dollar cycle at a time when everyone was expecting the dollar to collapse, and a top in the stock market when everyone was bullish and expecting a move back to new highs.
An interesting development in the yearly cycle for the stock market has now emerged. Generally speaking most yearly cycles tend to run about 12 months trough to trough. However the Fed's quantitative easing programs have stretched the yearly cycles from March 2009 into June of 2010, and this year the yearly cycle has stretched again to arrive in October. The market is now set up for the next yearly cycle low to occur in the fall of 2012, which, not surprisingly, is exactly when I have been expecting the next four year cycle low in stocks to bottom.

I have also indicated the expected timing band's for the next three intermediate degree cycle lows. For reasons explained in the nightly reports I don't think the current decline is going to move below the October low. I expect we will find a bottom sometime in the next 1-4 days followed by a Santa Claus rally into the middle of December. If the market avoids making a lower low it will embolden the Bulls to continue holding long positions. The hope for a miracle will be misplaced though as the market will almost certainly begin to roll over before making higher highs and by the next intermediate degree bottom in February/March we will see the October lows broken, and the summer 2010 lows tested.
The recent rally out of the October low will undoubtedly be the most powerful countertrend rally of this bear market. Any further countertrend rallies, and there will be several, are likely to be short-lived and weak. The window of opportunity for these long side trades are probably going to be too brief for the average investor/trader to successfully trade. From this point on investors should keep 401(k) accounts solely in money market funds until we reach the bottom sometime in the fall of 2012.
This brings us to the topic of gold. Despite what is happening in the stock market gold is clearly still in a secular bull market. That being said the days of easy money from the gold bull are probably over for the next year as stocks move down into their four year cycle low. In the chart below you can clearly see the affects QE1 & 2 had on the gold bull.

They drove the largest C-wave advance of this entire secular bull market. However, for reasons that I will explain below I think the C-wave topped in September and gold is now going to enter an extended consolidation phase for the next year.
That begs the question if the C-wave has topped then where was the D-wave? Well I think we just saw it in September. Let me explain.
Because of the massive liquidity floating around the world I now think the D-wave terminated with the overnight spike down to $1535 on September 26. I'm now seriously considering that the last D-wave was exceptionally mild because of the extreme global liquidity. If that is the case then gold has now entered an A-wave advance. As most of you know A-waves don't tend to make new highs. So my best guess is that gold will test the $1900 level sometime in the next three weeks followed by an extended corrective move down into an intermediate degree bottom in February (B-wave). That bottom should hold above the $1535 level. What should then follow will be a year long frustrating, whipsawing, consolidation that should terminate slightly before the stock market bottoms in the fall of 2012.

At that point gold will start to sniff out the next round of massive quantitative easing as the Fed and central banks around the world go into full panic mode and begin printing unimaginable amounts of money in the attempt to halt the global sovereign debt implosions and economic depression that will have developed. As usual central planners will not account for the unintended consequences of their actions. This time quantitative easing is going to have the opposite affect that it did in 2009. Yes it will put a bottom in stocks, at least temporarily, but it is also going accelerate the cancer that has now infected currency markets. And as currencies start to collapse so will global bond markets. This is the recipe for the final bubble phase in the gold bull market.
While gold is in this long consolidation phase/bear market phase for stocks, trading strategies will be vastly different than they were during QE1 and QE2. Trades are going to be shorter and there will be long periods of time where the correct strategy is to just sit in cash. I started to make the transition to this new trading strategy back in July. The recent breakdown in stocks has now eliminated any reservations I had about the bear market. With that confirmed, there is little doubt that gold has now entered an extended consolidation and that new trading strategies are called for.
Make no mistake, we are now entering what will be one of the toughest markets ever to make money in. So far the model portfolio is performing admirably even in these tough conditions.
For anyone who would like to sample the nightly premium newsletter, I have opened a $10 one week trial subscription. You will have full access to the SMT premium website including all historical archives, model portfolio, and terminology document for a full week. If during the week you decide the subscription is not for you, or the shorter term trading strategies don't suit you emotionally than simply cancel your subscription by following the directions on the homepage prior to your week expiring. If you do enjoy the newsletter then simply do nothing and your subscription will convert to a yearly membership at the end of the one week trial. Click here to link to the premium website. You will find the subscribe link on the upper right-hand side of the home page.
Back in April of this year I warned investors to get out of stocks in their 401(k) accounts. At the time the dollar was moving into the timing band for a major three year cycle low. It has always been my expectation that the rally out of that major bottom would correspond with the stock market moving down into the third bear market leg of the secular trend that has been in place since 2000. As we now know the dollar did bottom in May of this year and that did correspond with the top of the cyclical bull market that began in March of 2009. It has also been my expectation that the next four year cycle low would occur in the fall of 2012, and that 2012 would be one of the worst economic years in human history.
This is already starting to unfold across the globe as social unrest that began in the middle east has spread to Europe and now the United States. Economic data has been steadily eroding for months now. We should expect this trend to continue and intensify as we get into 2012.
As most of you know I use cycles analysis and sentiment to determine likely timing band's for major turns in the stock market, gold and the dollar. This is what allowed me to anticipate a bottom in the dollar cycle at a time when everyone was expecting the dollar to collapse, and a top in the stock market when everyone was bullish and expecting a move back to new highs.
An interesting development in the yearly cycle for the stock market has now emerged. Generally speaking most yearly cycles tend to run about 12 months trough to trough. However the Fed's quantitative easing programs have stretched the yearly cycles from March 2009 into June of 2010, and this year the yearly cycle has stretched again to arrive in October. The market is now set up for the next yearly cycle low to occur in the fall of 2012, which, not surprisingly, is exactly when I have been expecting the next four year cycle low in stocks to bottom.
I have also indicated the expected timing band's for the next three intermediate degree cycle lows. For reasons explained in the nightly reports I don't think the current decline is going to move below the October low. I expect we will find a bottom sometime in the next 1-4 days followed by a Santa Claus rally into the middle of December. If the market avoids making a lower low it will embolden the Bulls to continue holding long positions. The hope for a miracle will be misplaced though as the market will almost certainly begin to roll over before making higher highs and by the next intermediate degree bottom in February/March we will see the October lows broken, and the summer 2010 lows tested.
The recent rally out of the October low will undoubtedly be the most powerful countertrend rally of this bear market. Any further countertrend rallies, and there will be several, are likely to be short-lived and weak. The window of opportunity for these long side trades are probably going to be too brief for the average investor/trader to successfully trade. From this point on investors should keep 401(k) accounts solely in money market funds until we reach the bottom sometime in the fall of 2012.
This brings us to the topic of gold. Despite what is happening in the stock market gold is clearly still in a secular bull market. That being said the days of easy money from the gold bull are probably over for the next year as stocks move down into their four year cycle low. In the chart below you can clearly see the affects QE1 & 2 had on the gold bull.
They drove the largest C-wave advance of this entire secular bull market. However, for reasons that I will explain below I think the C-wave topped in September and gold is now going to enter an extended consolidation phase for the next year.
That begs the question if the C-wave has topped then where was the D-wave? Well I think we just saw it in September. Let me explain.
Because of the massive liquidity floating around the world I now think the D-wave terminated with the overnight spike down to $1535 on September 26. I'm now seriously considering that the last D-wave was exceptionally mild because of the extreme global liquidity. If that is the case then gold has now entered an A-wave advance. As most of you know A-waves don't tend to make new highs. So my best guess is that gold will test the $1900 level sometime in the next three weeks followed by an extended corrective move down into an intermediate degree bottom in February (B-wave). That bottom should hold above the $1535 level. What should then follow will be a year long frustrating, whipsawing, consolidation that should terminate slightly before the stock market bottoms in the fall of 2012.
At that point gold will start to sniff out the next round of massive quantitative easing as the Fed and central banks around the world go into full panic mode and begin printing unimaginable amounts of money in the attempt to halt the global sovereign debt implosions and economic depression that will have developed. As usual central planners will not account for the unintended consequences of their actions. This time quantitative easing is going to have the opposite affect that it did in 2009. Yes it will put a bottom in stocks, at least temporarily, but it is also going accelerate the cancer that has now infected currency markets. And as currencies start to collapse so will global bond markets. This is the recipe for the final bubble phase in the gold bull market.
While gold is in this long consolidation phase/bear market phase for stocks, trading strategies will be vastly different than they were during QE1 and QE2. Trades are going to be shorter and there will be long periods of time where the correct strategy is to just sit in cash. I started to make the transition to this new trading strategy back in July. The recent breakdown in stocks has now eliminated any reservations I had about the bear market. With that confirmed, there is little doubt that gold has now entered an extended consolidation and that new trading strategies are called for.
Make no mistake, we are now entering what will be one of the toughest markets ever to make money in. So far the model portfolio is performing admirably even in these tough conditions.
For anyone who would like to sample the nightly premium newsletter, I have opened a $10 one week trial subscription. You will have full access to the SMT premium website including all historical archives, model portfolio, and terminology document for a full week. If during the week you decide the subscription is not for you, or the shorter term trading strategies don't suit you emotionally than simply cancel your subscription by following the directions on the homepage prior to your week expiring. If you do enjoy the newsletter then simply do nothing and your subscription will convert to a yearly membership at the end of the one week trial. Click here to link to the premium website. You will find the subscribe link on the upper right-hand side of the home page.
Tuesday, November 22, 2011
Saturday, November 19, 2011
Friday, November 18, 2011
HAS THE BEAR RETURNED?
The recent market action has me wondering if the next leg down in the cyclical bear market has begun.
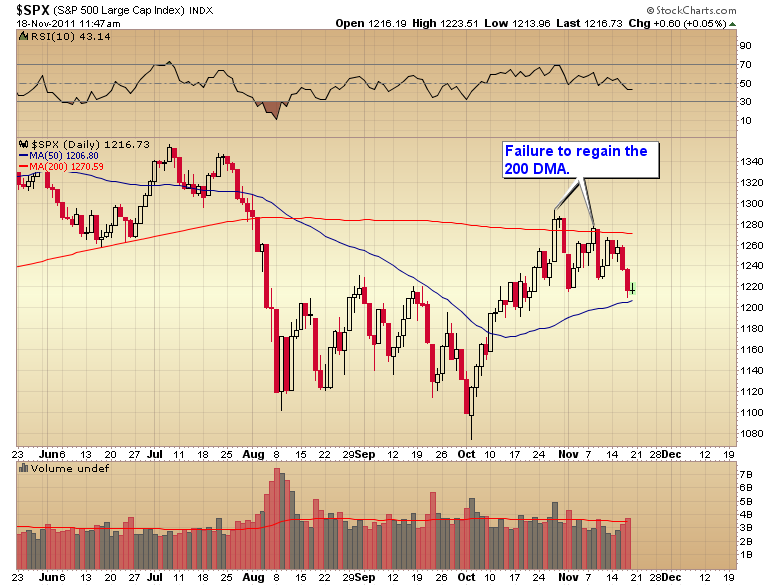
I always expected that we would see a very convincing rally out of the October yearly cycle low. I thought it even possible that we would test the 200 day moving average. Most bear markets do rally out of the initial leg down and test the 200 day moving average.

Recently the S&P made two attempts to close and hold above the 200 day moving average. They both failed. That was a pretty loudly warning bell ringing.
As a matter fact every index, except the utilities, is now trading below its declining 200 day moving average, and that includes all the major European and Asian markets.
At the moment the major concern is that the market is now moving into the timing band for a major daily cycle low (due in the next 5 to 10 days). The current daily cycle is left translated (topped in less than 20 days). That is relevant because most of the time left translated cycles move below their prior cycle bottom. The last cycle low occurred in October at 1075. Now I'm not suggesting that the stock market is going to crash below 1075 in the next 5 to 7 days. However the S&P has broken below the 1220 support zone. When support was broken in July it led to a seven-day 17% crash.
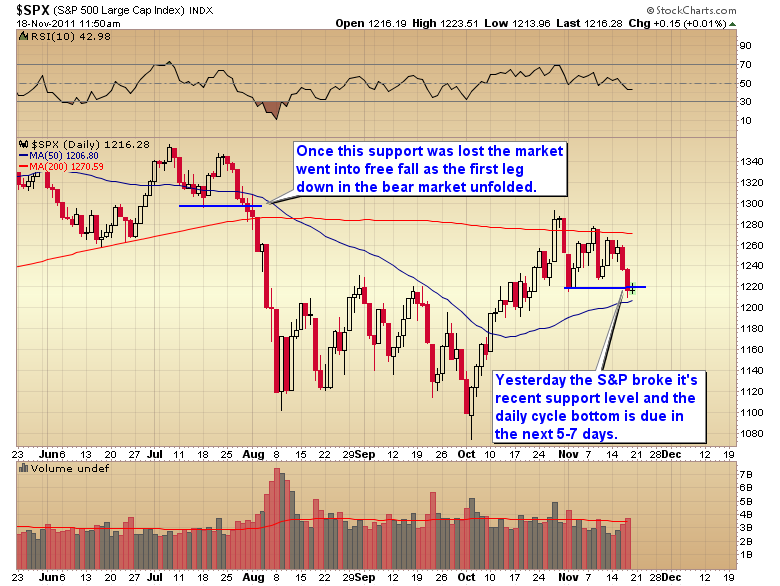
I don't know if breaking of support this time will lead to another climax selling event or not. I do know that the market is now in the timing band for some serious selling. I know that this is beginning to look like a counter trend rally in a bear market that is in the process of topping. And if that's true then we are in the period of time when the next leg down should begin.
Confirming this is the fact that the dollar index has rallied back above the 200 day moving average and completed an intermediate cycle bottom. The dollar index is currently on only the third week of this new intermediate cycle. Those cycles tend to run about 20 weeks, so there is potentially many more weeks of upside left before the dollar moves down into another significant correction, which presumably would drive the next bear market rally in stocks.
The safest position at this time is to be in cash, and that's exactly what I did with the model portfolio yesterday morning.
I always expected that we would see a very convincing rally out of the October yearly cycle low. I thought it even possible that we would test the 200 day moving average. Most bear markets do rally out of the initial leg down and test the 200 day moving average.
Recently the S&P made two attempts to close and hold above the 200 day moving average. They both failed. That was a pretty loudly warning bell ringing.
As a matter fact every index, except the utilities, is now trading below its declining 200 day moving average, and that includes all the major European and Asian markets.
At the moment the major concern is that the market is now moving into the timing band for a major daily cycle low (due in the next 5 to 10 days). The current daily cycle is left translated (topped in less than 20 days). That is relevant because most of the time left translated cycles move below their prior cycle bottom. The last cycle low occurred in October at 1075. Now I'm not suggesting that the stock market is going to crash below 1075 in the next 5 to 7 days. However the S&P has broken below the 1220 support zone. When support was broken in July it led to a seven-day 17% crash.
I don't know if breaking of support this time will lead to another climax selling event or not. I do know that the market is now in the timing band for some serious selling. I know that this is beginning to look like a counter trend rally in a bear market that is in the process of topping. And if that's true then we are in the period of time when the next leg down should begin.
Confirming this is the fact that the dollar index has rallied back above the 200 day moving average and completed an intermediate cycle bottom. The dollar index is currently on only the third week of this new intermediate cycle. Those cycles tend to run about 20 weeks, so there is potentially many more weeks of upside left before the dollar moves down into another significant correction, which presumably would drive the next bear market rally in stocks.
The safest position at this time is to be in cash, and that's exactly what I did with the model portfolio yesterday morning.
Thursday, November 17, 2011
Sunday, November 13, 2011
DOLLAR TEETERING ON THE ABYSS
We all better hope I'm wrong on this one, but I think the CRB just put in its three year cycle low in October. I'm also afraid that Bernanke has done irreparable damage to the dollar. If I'm right about both of those assumptions then we are on the brink of a historic inflationary period.
I've marked the major three year cycle bottoms in both the CRB index and the dollar in the chart below with blue arrows. (Actually the CRB cycle tends to run about two and half years on average.)
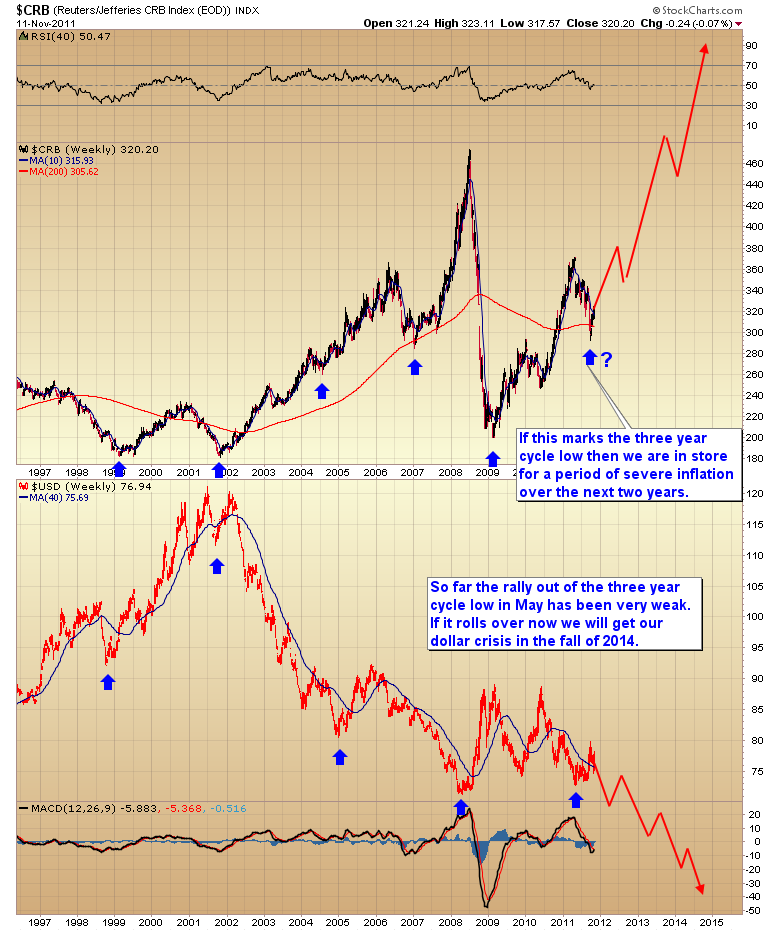
The dollar is now a great risk of forming a left translated three year cycle. A break below the October 27 intraday low would initiate a pattern of lower lows and lower highs of an intermediate degree.That is usually a sign that a major cycle has topped. If the dollar's three year cycle has topped after only five months we will be at great risk of a severe currency crisis in the fall of 2014 when the next three year cycle low is due.
Even more concerning is if the CRB cycle has bottomed. If it has then commodities are poised for a huge surge higher during the next two years as the dollar deteriorates.
The next two weeks are going to be critical for the dollar. It must hold above the October 27 low. Failure to do so would indicate that the cancer has now infected the currency markets, most specifically the US dollar.
If this scenario unfolds it has the potential to drive the bubble phase of the gold bull market.
I've marked the major three year cycle bottoms in both the CRB index and the dollar in the chart below with blue arrows. (Actually the CRB cycle tends to run about two and half years on average.)
The dollar is now a great risk of forming a left translated three year cycle. A break below the October 27 intraday low would initiate a pattern of lower lows and lower highs of an intermediate degree.That is usually a sign that a major cycle has topped. If the dollar's three year cycle has topped after only five months we will be at great risk of a severe currency crisis in the fall of 2014 when the next three year cycle low is due.
Even more concerning is if the CRB cycle has bottomed. If it has then commodities are poised for a huge surge higher during the next two years as the dollar deteriorates.
The next two weeks are going to be critical for the dollar. It must hold above the October 27 low. Failure to do so would indicate that the cancer has now infected the currency markets, most specifically the US dollar.
If this scenario unfolds it has the potential to drive the bubble phase of the gold bull market.
Wednesday, November 9, 2011
Sunday, November 6, 2011
NEW INTERMEDIATE CYCLE
Gold has now confirmed that an intermediate bottom was set on September 26. The double bottom at $1600 is a powerful basing pattern that should generate a test of the $2000 level by sometime in December.
 For reasons covered in the nightly reports I don't really expect gold to push much above the $2000 level during this particular intermediate cycle.
Also for reasons discussed in the nightly reports I think the mining stocks, which have been unloved for the last year, are probably going to be the recipients of most of the hot money during this intermediate cycle. Both silver and gold have already generated parabolic, or semi parabolic moves. I think it's time for a big rally in the mining stocks over the next four or five months.
Also for reasons discussed in the nightly reports I think the mining stocks, which have been unloved for the last year, are probably going to be the recipients of most of the hot money during this intermediate cycle. Both silver and gold have already generated parabolic, or semi parabolic moves. I think it's time for a big rally in the mining stocks over the next four or five months.
Wednesday, October 26, 2011
D-WAVE ABORTED
In my last post I hypothesized that the bear market in stocks had finally sunk its teeth into the precious metals sector. I was looking for a final move down into a true D-wave bottom, coupled with the HUI dropping down to test the 200 week moving average. I could not have been more wrong!
Instead gold formed a double bottom at $1600 and yesterday confirmed a trend change to a pattern of higher highs and higher lows.

As is usually the case the miners played follow the leader and reversed their downtrend also.

It is now clear that gold put in an intermediate degree bottom on September 26. The double bottom is a much stronger basing pattern then a V-shaped rebound and should launch a test of the $2000 level at some point during this intermediate cycle.
Instead gold formed a double bottom at $1600 and yesterday confirmed a trend change to a pattern of higher highs and higher lows.
As is usually the case the miners played follow the leader and reversed their downtrend also.
It is now clear that gold put in an intermediate degree bottom on September 26. The double bottom is a much stronger basing pattern then a V-shaped rebound and should launch a test of the $2000 level at some point during this intermediate cycle.
Tuesday, October 25, 2011
Monday, October 24, 2011
Friday, October 21, 2011
Thursday, October 20, 2011
THE LAST SECTOR TO GO
At this point I think it's pretty clear the general stock market is now in the initial phase of a new bear market. It's trying to generate a bear market rally over the last three weeks, but so far it's been pretty weak. That doesn't bode well once the cyclical and secular bear trend resumes.
The HUI mining index is now on the verge of breaking down out of the multi-month megaphone topping pattern. Once it does that will confirm that the bear now has his teeth in the last holdout sector. The sector that led the bull market over the last 2 1/2 years and now the last sector to succumb to the deflationary forces.
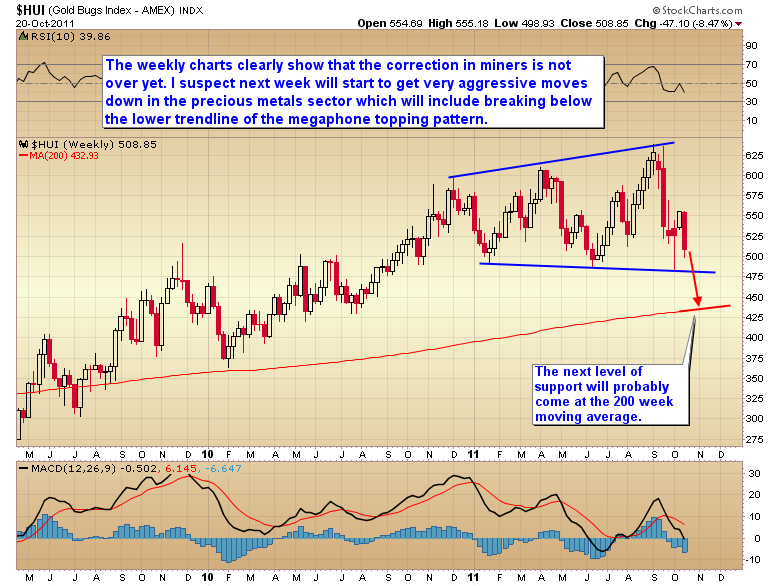
As I have noted in the chart I do expect the miners will find at least temporary support at the 200 week moving average. That should correspond with gold putting in an intermediate degree bottom sometime in the next two or maybe three weeks. Presumably it will come with gold below $1535. My best guess is that gold will make an attempt to test the 75 week moving average at that intermediate bottom.

At that point gold should be severely oversold enough to generate a very powerful, snap back, A-wave rally. That should be followed by a multi-month consolidation as gold works off the huge gains of the last 2 1/2 years. This while the stock market continues down into its final four year cycle low.
I expect the miners will produce a substantial rally off the 200 week moving average also but I'm afraid they will continue to get dragged down by the general bear market in stocks even if gold does form a high-level consolidation over the next year.

So while I expect to see a great buying opportunity on miners in the next few weeks I doubt it will be a long-term type trade. That probably won't occur until the stock market puts in its final four year cycle low sometime in the fall of next year.
The HUI mining index is now on the verge of breaking down out of the multi-month megaphone topping pattern. Once it does that will confirm that the bear now has his teeth in the last holdout sector. The sector that led the bull market over the last 2 1/2 years and now the last sector to succumb to the deflationary forces.
As I have noted in the chart I do expect the miners will find at least temporary support at the 200 week moving average. That should correspond with gold putting in an intermediate degree bottom sometime in the next two or maybe three weeks. Presumably it will come with gold below $1535. My best guess is that gold will make an attempt to test the 75 week moving average at that intermediate bottom.
At that point gold should be severely oversold enough to generate a very powerful, snap back, A-wave rally. That should be followed by a multi-month consolidation as gold works off the huge gains of the last 2 1/2 years. This while the stock market continues down into its final four year cycle low.
I expect the miners will produce a substantial rally off the 200 week moving average also but I'm afraid they will continue to get dragged down by the general bear market in stocks even if gold does form a high-level consolidation over the next year.
So while I expect to see a great buying opportunity on miners in the next few weeks I doubt it will be a long-term type trade. That probably won't occur until the stock market puts in its final four year cycle low sometime in the fall of next year.
Saturday, October 15, 2011
THE MOST IMPORTANT DECISION BERNANKE WILL EVER MAKE
As many of you know who have read my work in the past, the dollar put in a major three year cycle low back in May. It has been my expectation all along that the rally out of that major bottom would coincide with another deflationary period and the next leg down in the stock secular bear market. So far this has been the case as stocks topped in May at the same time the dollar bottomed.

After a 15 week consolidation the dollar has initiated its first powerful thrust up out of that major bottom. As you can see in the chart below the rally out of a three year cycle low generally lasts at least a year and turns the 200 day moving average back up.

I've also noted that once the rally out of a three year cycle low rises above the 200 day moving average, it shouldn't dip back below that level, at least not for the next year to year and a half.
Sometime in the next few days the dollar will put in a daily cycle low and bounce. My expectation is that it will either bounce off of the 200 day moving average or bottom slightly above that level. It's what comes next after that bounce that is absolutely critical.
Bernanke is now about to make the most important decision of his life. The correct decision is to allow the dollar to appreciate, which in turn would continue to drive the stock market down into its next four year cycle low in the fall of 2012, and would facilitate a much-needed recession to cleanse at least some of the massive debt that has been accumulated in the last two years. That is the correct decision. It is also a very hard decision because it will lead to severe short-term pain and undoubtedly another depression on the same scale as 1932.
However if Bernanke chooses to kick the can down the road again and continues his failed policy of monetary debasement then the dollar is at great risk of forming an extreme left translated three year cycle.
For those of you that are new to cycles analysis, a left translated cycle is generally associated with a bear market. Left translated means that the cycle tops in the front half of its cycle timing band. In this case any top that forms prior to 18 months would signal a left translated three year cycle. Furthermore the more extreme translated a cycle is the more severe the decline tends to be, simply because the cycle has a lot more time to move lower.
If Bernanke decides to avoid short-term pain and kicks the can down the road again with further currency debasement, then the dollar is at great risk of having already put in the top of this three year cycle.
The unintended consequences of a three year cycle that tops in only four months are, to put it mildly, horrendous. That would indicate that the dollar is going to head generally lower for the next three years culminating in a hyper-inflationary event at the next three year cycle low in 2014.

The next couple of weeks and months are going to be of grave importance. The dollar needs to find support at the 200 day moving average and resume moving strongly higher. That would of course put pressure on the stock market and probably terminate the current bear market rally somewhere around the 200 day moving average (roughly SPX 1270ish) before the next leg down begins.
If however the bounce out of the now due daily cycle low is weak and the dollar rolls over quickly and moves back below the 200 day moving average then all bets are off. Stocks could even rally back to marginal new highs. However that would also guarantee that the CRB has put in its three year cycle low and we are now at the very beginning of an inflationary Holocaust.

If Bernanke makes the wrong decision then gold is on the verge of moving into the bubble phase of the secular bull market. That being said gold should still experience one more move down in the next couple of weeks as the dollar rallies out of its impending daily cycle low. After that, everything hinges on Bernanke's decision whether or not to continue his failed monetary policies.
After a 15 week consolidation the dollar has initiated its first powerful thrust up out of that major bottom. As you can see in the chart below the rally out of a three year cycle low generally lasts at least a year and turns the 200 day moving average back up.
I've also noted that once the rally out of a three year cycle low rises above the 200 day moving average, it shouldn't dip back below that level, at least not for the next year to year and a half.
Sometime in the next few days the dollar will put in a daily cycle low and bounce. My expectation is that it will either bounce off of the 200 day moving average or bottom slightly above that level. It's what comes next after that bounce that is absolutely critical.
Bernanke is now about to make the most important decision of his life. The correct decision is to allow the dollar to appreciate, which in turn would continue to drive the stock market down into its next four year cycle low in the fall of 2012, and would facilitate a much-needed recession to cleanse at least some of the massive debt that has been accumulated in the last two years. That is the correct decision. It is also a very hard decision because it will lead to severe short-term pain and undoubtedly another depression on the same scale as 1932.
However if Bernanke chooses to kick the can down the road again and continues his failed policy of monetary debasement then the dollar is at great risk of forming an extreme left translated three year cycle.
For those of you that are new to cycles analysis, a left translated cycle is generally associated with a bear market. Left translated means that the cycle tops in the front half of its cycle timing band. In this case any top that forms prior to 18 months would signal a left translated three year cycle. Furthermore the more extreme translated a cycle is the more severe the decline tends to be, simply because the cycle has a lot more time to move lower.
If Bernanke decides to avoid short-term pain and kicks the can down the road again with further currency debasement, then the dollar is at great risk of having already put in the top of this three year cycle.
The unintended consequences of a three year cycle that tops in only four months are, to put it mildly, horrendous. That would indicate that the dollar is going to head generally lower for the next three years culminating in a hyper-inflationary event at the next three year cycle low in 2014.
The next couple of weeks and months are going to be of grave importance. The dollar needs to find support at the 200 day moving average and resume moving strongly higher. That would of course put pressure on the stock market and probably terminate the current bear market rally somewhere around the 200 day moving average (roughly SPX 1270ish) before the next leg down begins.
If however the bounce out of the now due daily cycle low is weak and the dollar rolls over quickly and moves back below the 200 day moving average then all bets are off. Stocks could even rally back to marginal new highs. However that would also guarantee that the CRB has put in its three year cycle low and we are now at the very beginning of an inflationary Holocaust.
If Bernanke makes the wrong decision then gold is on the verge of moving into the bubble phase of the secular bull market. That being said gold should still experience one more move down in the next couple of weeks as the dollar rallies out of its impending daily cycle low. After that, everything hinges on Bernanke's decision whether or not to continue his failed monetary policies.
Thursday, October 13, 2011
THE BIG PICTURE
More often than not we as investors get caught up in the day-to-day action and never take the time to step back and look at the big picture. Today I'm just going to post some long term charts with appropriate annotations.


THE LIGHT AT THE END OF THE TUNNEL.

THE LIGHT AT THE END OF THE TUNNEL.
Tuesday, October 11, 2011
THE 75 WEEK CEILING
The 75 week moving average has been a very clear dividing line between bull and bear markets for the last couple of decades.

The S&P is on the verge of running in to that roadblock soon.
 It's possible that the S&P could penetrate this level briefly, and possibly even rally back to the 200 day moving average (about 1250) before the bear market resumes. That being said I doubt the market will be able to penetrate this major resistance level on the first try, and it may even end up capping this bear market rally.
We already have three warning signs that popped up today that should make bulls wary. More in tonight's report...
The S&P is on the verge of running in to that roadblock soon.
We already have three warning signs that popped up today that should make bulls wary. More in tonight's report...
Monday, October 10, 2011
Saturday, October 8, 2011
GOLD AT A MAJOR CROSSROADS
I think next week will mark a major turning point in the gold market. Depending on whether the dollar continues higher or turns back down we will either see a resumption of the D-Wave decline or this will just turn into a normal run-of-the-mill intermediate degree correction followed by another leg up in this 2 1/2 year C-wave advance.
First the pros:
The COT report has now reached a maximum bullish level on the commercial contracts. In the past this has always marked major bottom turning points.

Sentiment & breadth have reached extreme bearish levels (contrary indicator).


First the pros:
The COT report has now reached a maximum bullish level on the commercial contracts. In the past this has always marked major bottom turning points.
Sentiment & breadth have reached extreme bearish levels (contrary indicator).
Chart courtesy of sentimentrader.com
It's possible that gold has formed a small T-1 continuation pattern (A move followed by a sideways range often precedes another move of almost equal extent in the same direction as the original move. Generally, when the second move from the sideways range has run its course, a counter move approaching the sideways range may be expected.)
There is a small problem with this interpretation as the second leg of a T-1 pattern is generally slightly smaller than the first leg.
The cons:
The current intermediate cycle is too short. Barring a shortened cycle, which does occur rarely, there should be one more leg down into the normal timing band for an intermediate degree cycle bottom (20-25 weeks).
Also the HUI mining index is potentially forming a megaphone topping pattern. If gold does have one more move down into a true D-Wave bottom then the bounce off the lower trend line should fail followed by one more aggressive move lower.
Also there is a much larger T-1 pattern in play that fits the normal parameters much better than the smaller version.
You can see from the chart above that unlike the smaller T-1 the larger version does feature a second leg slightly smaller than the first, and if this pattern is playing out then we need one more move lower to test the midpoint consolidation zone.
Right now the battle is being fought at the $1600 level. So far every time gold reaches that level buyers step in.
If however gold closes below $1600 that would be a serious warning sign that the current daily cycle will be left translated and that gold is indeed caught in a true D-Wave decline. If that's the case it still needs to test the consolidation zone of the large T-1 pattern and the intermediate degree cycle will bottom in the normal timing band (November). If this scenario unfolds then we can look for an A-wave advance to begin once that final D-Wave bottom is in place.
As I have noted before A-waves usually test but fail to exceed the prior C wave top. They are almost always followed by a lengthy 1-1 1/2 year consolidation before the next leg up can begin.
In my opinion next week is going to be critical. Either the current daily cycle is going to break down below $1600 in a left translated manner, in which case we will probably see gold continue sharply lower to test the 75 week moving average and the consolidation zone of the large T-1 pattern. Or if gold can gain some traction and breakout of the recent trading range to the upside then the smaller T-1 pattern comes in to play and we should see gold make another run at $2000.
Thursday, October 6, 2011
Wednesday, October 5, 2011
Tuesday, October 4, 2011
EUROPE TO THE RESCUE
It appears that the news out of Europe, right before the close, that the EU is looking at further measures to recapitalize the banks, was enough to halt what was likely going to turn into a very nasty drop into the employment report on Friday. Instead what started as potentially very ugly morphed into a key reversal day. Since the market was getting very late in its daily cycle this will likely mark not only a daily cycle low, but a greater degree intermediate cycle low.

I've noted in the past that these intermediate degree bottoms are often accompanied by a significant divergence in momentum. You can see on the chart below that this often plays out as a large divergence in the McClellan oscillator.

The market should now make another attempt at a respectable bear market rally. I would think a very minimum would be a return to the 75 week moving average.

And considering the amount of time the market has been consolidating a move back to the 200 day moving average is not completely out of the question.

I think we probably just saw a major turning point today. One that should mark a bottom for at least a couple of months.
I've had quite a few requests for a trial subscription link. The last $5.00 offer seemed to garner quite a bit of interest so I am going to add a permanent trial subscription offer. $10 for 1 week of full access to the premium SMT report. If you decide you like the premium newsletter your subscription will automatically convert to the yearly rate after seven days. If not, just cancel your subscription prior to your week expiring.
To access the trial subscription click here and then click on the subscribe link on the right-hand side of the homepage.
I've noted in the past that these intermediate degree bottoms are often accompanied by a significant divergence in momentum. You can see on the chart below that this often plays out as a large divergence in the McClellan oscillator.
The market should now make another attempt at a respectable bear market rally. I would think a very minimum would be a return to the 75 week moving average.
And considering the amount of time the market has been consolidating a move back to the 200 day moving average is not completely out of the question.
I think we probably just saw a major turning point today. One that should mark a bottom for at least a couple of months.
I've had quite a few requests for a trial subscription link. The last $5.00 offer seemed to garner quite a bit of interest so I am going to add a permanent trial subscription offer. $10 for 1 week of full access to the premium SMT report. If you decide you like the premium newsletter your subscription will automatically convert to the yearly rate after seven days. If not, just cancel your subscription prior to your week expiring.
To access the trial subscription click here and then click on the subscribe link on the right-hand side of the homepage.
Saturday, October 1, 2011
BACK TO THE BEGINNING
Bear markets are about cleansing the excesses of the prior bull market. Secular bear markets are about P/E compression, a move from extreme overvaluation to extreme undervaluation. The current secular bear market is now in its 11th year and in the initial phase of its third leg down.
As many of you know I expect next year to be one of the worst years in human history, at least economically speaking. Certainly on par with 1932 if not worse. This should drive one of the worst stock bear markets in history. Before this secular bear market expires we need to cleanse all of the excesses that were generated during the final bubble years leading up to the top in 2000.
I'm expecting at next year's four year cycle low, which should occur in the fall, that we will see a true secular bear market bottom. That means single-digit P/E ratios, along with a dividend yields on the S&P above 5%. I also expect this leg down will erase all of the gains during the bubble years from 1995-2000.

However I don't think we will be quite out of the woods yet. We will probably have to endure one more nasty leg down in this secular bear market before we put in an inflation adjusted low, likely it will occur in 2016 with a final bottom slightly above the 2012 bottom. At that point we should begin a new secular bull market that I think will be driven by truly astounding discoveries made in the field of biotech and nanotechnology.
But first we have to get back to the beginning.
As many of you know I expect next year to be one of the worst years in human history, at least economically speaking. Certainly on par with 1932 if not worse. This should drive one of the worst stock bear markets in history. Before this secular bear market expires we need to cleanse all of the excesses that were generated during the final bubble years leading up to the top in 2000.
I'm expecting at next year's four year cycle low, which should occur in the fall, that we will see a true secular bear market bottom. That means single-digit P/E ratios, along with a dividend yields on the S&P above 5%. I also expect this leg down will erase all of the gains during the bubble years from 1995-2000.
However I don't think we will be quite out of the woods yet. We will probably have to endure one more nasty leg down in this secular bear market before we put in an inflation adjusted low, likely it will occur in 2016 with a final bottom slightly above the 2012 bottom. At that point we should begin a new secular bull market that I think will be driven by truly astounding discoveries made in the field of biotech and nanotechnology.
But first we have to get back to the beginning.
Tuesday, September 27, 2011
Saturday, September 24, 2011
THE D-WAVE BEGINS
It's taken much longer than I originally expected, but we now have confirmation that gold's D-Wave decline has begun.
A D-Wave decline is a normal, regression to the mean, profit-taking event that occurs when gold gets too stretched above the mean. It is not a take down by an anti-gold cartel. Anyone with a modicum of common sense can look at the long-term chart of gold and tell that this is not a manipulated market. This is just a normal secular bull market, and it is acting exactly like a normal bull market acts.

Folks, these conspiracy theories are now bordering on the insane. I even heard the other day someone blame margin increases for the drop in gold. I guess they completely forgot that we've already had two margin increases in the last two months that had virtually no effect on gold.

Every bull market in history has its share of con men and scam artists. Think Bernie Madoff, Enron, WorldCom, etc. The gold manipulation nonsense is just one of the many scams that are going to hitch a ride on this bull. Actually it's one of the oldest scams in the book. You find a bull market, make a one-way bet on rising prices, tout these "to the moon" prices to suck in subscribers lured by the reward of gigantic financial gains, and then blame an invisible cartel every time a correction occurs that you don't foresee. It's a great way of not having to take responsibility when subscribers get caught in a normal corrective decline.
Needless to say I don't play those kind of games. I try to get subscribers out ahead of intermediate declines. Yes, I'm usually a little early. I have the same problem with tops that every other human being in the world has. They are virtually impossible to call in real time. Subscribers to the SMT newsletter have sidestepped all of this D-Wave decline and instead have been 100% invested in the dollar index. The only asset initiating a strong trend higher.
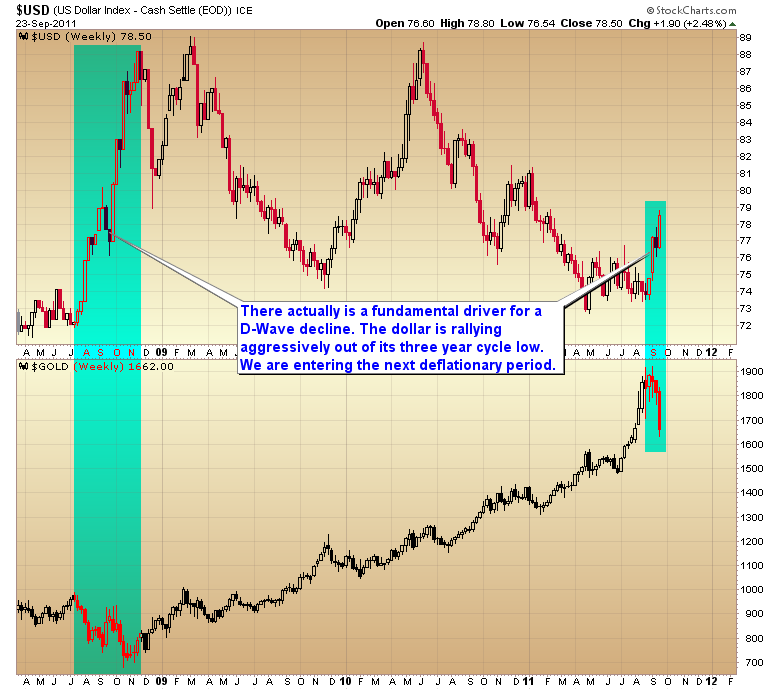
Actually there is a fundamental reason for a D-Wave decline besides just a normal regression to the mean, profit-taking event. The dollar has now moved into the aggressive stage of the rally out of the three year cycle low. Deflation is starting to take hold in the world again. In a deflation defaulting debt collapses the money supply. There is a growing shortage of dollars in the world. That's the reason why the dollar index is rocketing higher. As the value of the dollar rises during this deflation it takes less and less of them to buy an ounce of gold. You can see this same process unfolded as the dollar rallied out of the 2008 three year cycle low.
On a much shorter timescale gold is now in the timing band for a daily cycle low. My best guess is that sometime over the next 1 to 2 weeks gold will move down to tag the 200 day moving average. That will trigger short covering and a very convincing snapback rally. However it's still too early for an intermediate degree bottom. There should be one more daily cycle down into November before the D-Wave puts in its final bottom.
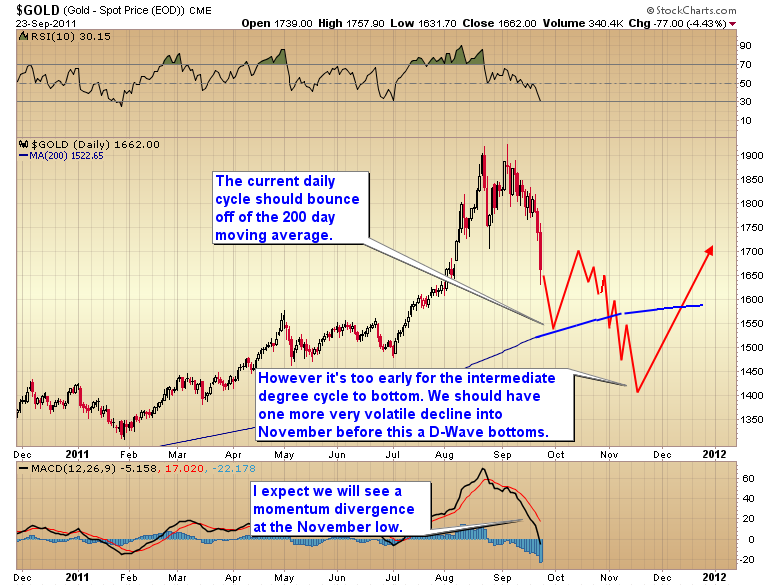
I suspect the next daily cycle is going to be a volatile nightmare that will chew up bulls and bears alike before a final plunge down below the 200 day moving average somewhere between $1300-$1400. As all D-Wave declines have retraced at least 50 to 60% of the previous C-wave advance that would be a minimum target for the November bottom. At that point we should see a very powerful A-wave advance triggered by the extreme oversold conditions generated at the D-Wave bottom. More in the weekend report...
For the next week I am going to open a special $5 trial subscription. You will have complete access to the premium website, archives, model portfolio, etc. You can sample the premium newsletter for a week. If you decide you like the content your subscription will automatically renew on October 1 as a yearly subscription. If you decide you don't want to continue the subscription just follow the directions on the home page of the website to cancel your subscription before October 1.
Click here to go to the premium website then click on the subscribe link on the right-hand side of the page. You will see the special offer at the bottom of the subscription page. Offer has expired
A D-Wave decline is a normal, regression to the mean, profit-taking event that occurs when gold gets too stretched above the mean. It is not a take down by an anti-gold cartel. Anyone with a modicum of common sense can look at the long-term chart of gold and tell that this is not a manipulated market. This is just a normal secular bull market, and it is acting exactly like a normal bull market acts.
Folks, these conspiracy theories are now bordering on the insane. I even heard the other day someone blame margin increases for the drop in gold. I guess they completely forgot that we've already had two margin increases in the last two months that had virtually no effect on gold.
Every bull market in history has its share of con men and scam artists. Think Bernie Madoff, Enron, WorldCom, etc. The gold manipulation nonsense is just one of the many scams that are going to hitch a ride on this bull. Actually it's one of the oldest scams in the book. You find a bull market, make a one-way bet on rising prices, tout these "to the moon" prices to suck in subscribers lured by the reward of gigantic financial gains, and then blame an invisible cartel every time a correction occurs that you don't foresee. It's a great way of not having to take responsibility when subscribers get caught in a normal corrective decline.
Needless to say I don't play those kind of games. I try to get subscribers out ahead of intermediate declines. Yes, I'm usually a little early. I have the same problem with tops that every other human being in the world has. They are virtually impossible to call in real time. Subscribers to the SMT newsletter have sidestepped all of this D-Wave decline and instead have been 100% invested in the dollar index. The only asset initiating a strong trend higher.
Actually there is a fundamental reason for a D-Wave decline besides just a normal regression to the mean, profit-taking event. The dollar has now moved into the aggressive stage of the rally out of the three year cycle low. Deflation is starting to take hold in the world again. In a deflation defaulting debt collapses the money supply. There is a growing shortage of dollars in the world. That's the reason why the dollar index is rocketing higher. As the value of the dollar rises during this deflation it takes less and less of them to buy an ounce of gold. You can see this same process unfolded as the dollar rallied out of the 2008 three year cycle low.
On a much shorter timescale gold is now in the timing band for a daily cycle low. My best guess is that sometime over the next 1 to 2 weeks gold will move down to tag the 200 day moving average. That will trigger short covering and a very convincing snapback rally. However it's still too early for an intermediate degree bottom. There should be one more daily cycle down into November before the D-Wave puts in its final bottom.
I suspect the next daily cycle is going to be a volatile nightmare that will chew up bulls and bears alike before a final plunge down below the 200 day moving average somewhere between $1300-$1400. As all D-Wave declines have retraced at least 50 to 60% of the previous C-wave advance that would be a minimum target for the November bottom. At that point we should see a very powerful A-wave advance triggered by the extreme oversold conditions generated at the D-Wave bottom. More in the weekend report...
For the next week I am going to open a special $5 trial subscription. You will have complete access to the premium website, archives, model portfolio, etc. You can sample the premium newsletter for a week. If you decide you like the content your subscription will automatically renew on October 1 as a yearly subscription. If you decide you don't want to continue the subscription just follow the directions on the home page of the website to cancel your subscription before October 1.
Click here to go to the premium website then click on the subscribe link on the right-hand side of the page. You will see the special offer at the bottom of the subscription page. Offer has expired
Subscribe to:
Posts (Atom)